Navigate360: Creating custom tiles for your Advisor Dashboard
The first step in creating custom tiles is to create a saved report (Navigate360: Building V3 Reports). Once that is completed, follow these steps:
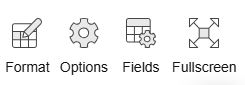
1) Run the saved report you wish to use. From that results page, you will create a pivot table by selecting the Pivot Table icon from the menu bar above the results.

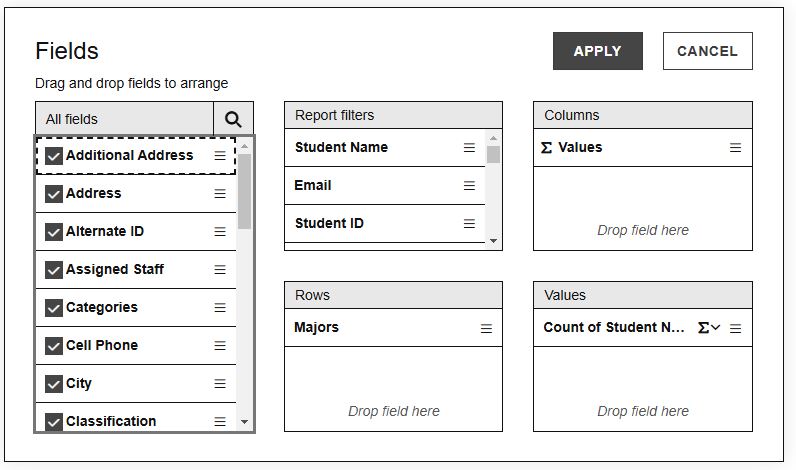
2) A new window will open where you will select the data points for your table or chart by selecting Fields.
3) You can drag and drop the fields you wish to use to the correct column or row. When you have selected the correct options, click Apply.
4) Save your report again.
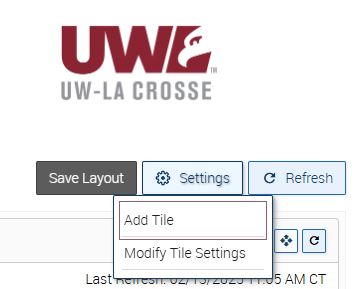
5) Navigate to your Advisor Dashboard: ![]()
6) Select Add Tile and the Add Tile menu panel will open.
7) Name your tile, and select the correct report.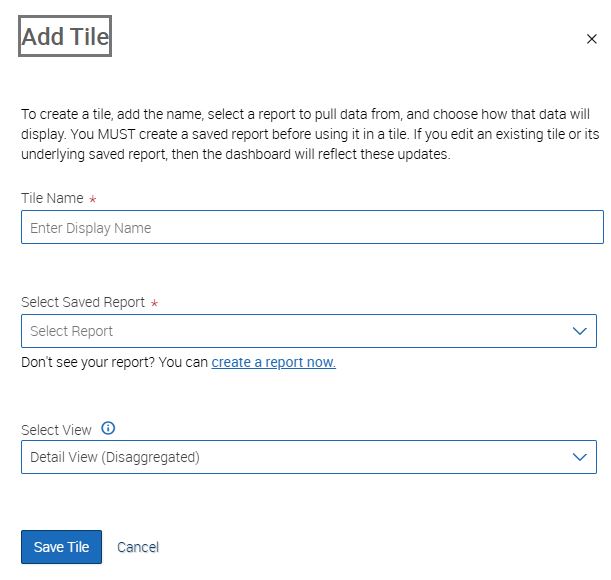
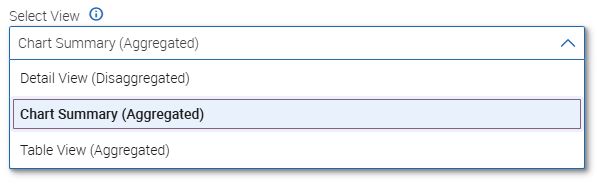
8) Select which view of the data you want on the tile, then click Save Tile.
9) Your dashboard will reload, and your new tile will appear towards the bottom of the page. You can then move the tile and further customize the page as needed (Navigate360: Advisor Dashboard).